
• Gantry Robot Manufacturer & Articulated Arm Integrator

How to Choose Pick and Place Automation for Your Business

Choosing pick and place automation is not simply a decision about buying the fastest robot. It is a decision about product handling, process stability, labor needs, and measurable return. In the International Federation of Robotics’ World Robotics 2024 report, factories installed 541,302 industrial robots worldwide in 2023. That scale shows strong confidence in automation. It does not guarantee a good investment for every business.

As Marina Bill, President of the International Federation of Robotics, stated, “Robots are a key driver for competitiveness and growth.” Her observation is relevant, but the benefit depends on practical engineering. A robot may achieve high cycle speeds in a demonstration. Your production line may face slippery packaging, inconsistent product spacing, dust, or frequent changeovers. These details matter. They often decide success.

This guide explains how to choose pick and place automation for your business. It considers payload, reach, cycle time, gripper design, machine vision, conveyor tracking, washdown requirements, and integration with existing equipment. PMMI’s packaging industry research repeatedly identifies labor availability and operational efficiency as important automation drivers. Yet speed alone should not control the decision. A modest system with reliable changeovers may outperform a faster system that frequently stops. That is an uncomfortable possibility. It deserves honest testing.

Before selecting equipment, record actual production data. Measure product weight, placement accuracy, hourly output, downtime, and changeover minutes. Then compare suppliers using total cost of ownership, service capability, training, and safety documentation. The right solution should fit your people and process, not only your production target.

How to Choose Pick and Place Automation for Your Business

Understanding Pick and Place Automation and Its Core Functions

Pick and place automation moves parts between defined locations with repeatable speed and accuracy. Its core functions are simple, but their interaction determines production results. A vision sensor identifies each item. A gripper secures it. A motion system transfers it. The controller coordinates timing, position, and release.

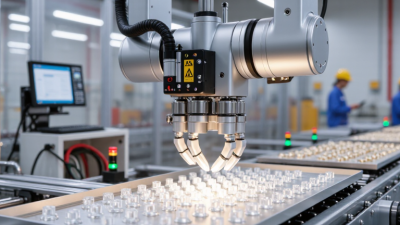
Different products require different handling methods. A vacuum tool suits flat, sealed surfaces. Mechanical fingers may handle uneven or porous parts better. The system must also manage weight, shape, surface finish, and spacing. For example, a line sorting small plastic caps may need rapid vision checks and gentle placement. Excessive gripping force can leave marks. Poor timing can create jams.

Small details matter.

During evaluation, measure cycle time under real operating conditions, not ideal demonstrations. Check whether lighting changes affect detection. Test dusty surfaces, mixed orientations, and occasional empty positions. These conditions expose weaknesses early. No setup is perfect. A tool that performs well today may struggle after a product change. This is where flexible programming, adjustable tooling, and accessible maintenance become valuable. Safety guarding, emergency controls, and operator access also require careful review. Reliable automation should be understandable to the people who monitor and service it, not only to its designer.

Assessing Your Business Needs and Production Requirements

How to Choose Pick and Place Automation for Your Business

Assessing your business needs should come before comparing automation equipment. Measure the actual production cycle, not the ideal target. Record product weight, dimensions, surface texture, and presentation accuracy. A small carton may need gentle gripping, while a sealed container may require vacuum handling. Check how often products change. Frequent variations can make flexible tooling more valuable than maximum speed.

Review your complete production line. Note conveyor height, available floor space, operator access, and downstream packaging requirements. The machine should match your slowest process, or bottlenecks may remain. Calculate the required cycle time using real demand, planned breaks, and maintenance periods. A theoretical rate can look impressive but fail during a busy shift. Confirm payload and reach with engineering data, then test representative products. Small differences matter.

Tips: Start with a short production trial. Use the heaviest product, the fastest required cycle, and the most difficult package. Ask operators to evaluate loading, cleaning, adjustments, and fault recovery. Their feedback is practical evidence. Also estimate training, spare parts, energy use, and scheduled maintenance. These costs are easy to overlook. A flexible system may reduce future disruption, but it can also require more setup discipline. That trade-off deserves an honest review.

Comparing Robot Types, Speeds, Payloads, and Reach

Choosing pick-and-place automation starts with the product, not the robot catalogue. The International Federation of Robotics reported 541,302 industrial robots were installed worldwide in 2023. That growth reflects demand for repeatable handling, but robot selection remains application-specific. Delta robots suit very fast movements with light products. SCARA robots offer strong precision for compact work cells. Six-axis robots provide flexible orientation and access. Gantry systems often deliver longer reach and higher payload capacity.

Compare speed carefully. A robot’s advertised cycle time may exclude gripping, vision checks, conveyor movement, and safety pauses. Payload must include the gripper and product together. Leave a practical margin for acceleration and uneven loads. Reach also matters near the edge of the workspace, where motion can slow or become awkward. The International Federation of Robotics recommends assessing the complete application, including integration and operating conditions. A spreadsheet can still lie when the carton is slippery.

Tips:
Record real cycle times from sample products. Test the heaviest package, not the average one. Check reach at every pickup and placement point. Measure floor space, conveyor height, and operator access. Interact Analysis has reported continued growth in warehouse automation, yet deployment problems often come from integration rather than robot speed. I would budget for trials, programming, and maintenance training. The first design is rarely perfect.

Evaluating Integration, Safety, Maintenance, and Scalability

Choosing pick and place automation starts with the production line, not the machine catalog. Confirm communication with your PLC, sensors, vision system, and existing conveyor. A capable integrator should test actual products, speeds, and placement accuracy before installation. “It should work” is not a commissioning plan.

Safety deserves equal attention. Use a documented risk assessment before selecting guards, interlocks, light curtains, or safe access points. Operators need clear loading areas and predictable restart procedures. Test the restart. I have seen projects focus on cycle time while ignoring awkward cleaning access. That decision usually creates unsafe workarounds later. The system must protect people without making normal tasks unnecessarily difficult.

Maintenance and scalability determine long-term value. Choose components with accessible service points, clear diagnostics, and locally available replacements. Track common faults during a trial run, then train technicians using real failure examples. Keep critical spares practical, not excessive. For future growth, consider modular tooling, adjustable conveyors, recipe-based controls, and spare electrical capacity. Leave room. A compact cell may fit today, but future products could require different grippers or longer reach. My own preference is to challenge every expansion assumption; some planned features never earn their cost. Start with measurable needs, document what remains uncertain, and review the design after operators have used it for several weeks.

How to Choose Pick and Place Automation for Your Business - Evaluating Integration, Safety, Maintenance, and Scalability
Practical evaluation framework for comparing robotic, gantry, delta, and other pick-and-place automation options. Adjust the weights to match your process, product, workforce, and regulatory requirements.
Evaluation Dimension Weight What to Evaluate Relevant Measures Recommended Target or Decision Rule Evidence to Request Priority
Process Fit 15% Whether the automation can handle the product range, presentation method, gripping requirements, orientation changes, and placement pattern. Product dimensions and mass; allowable contact force; SKU variation; product changeover time; reject and rework rate. Confirm reliable handling of the full approved product range, including the smallest, largest, lightest, heaviest, most fragile, and most slippery items. Application test using production-representative samples; documented assumptions; end-of-arm-tooling drawings; test results for difficult products. High
Throughput and Performance 15% Whether the system meets required output without compromising quality, product integrity, or equipment availability. Required units per minute; cycle time; uptime; first-pass yield; jam frequency; response to variable product spacing. Use a demonstrated production cycle time with realistic infeed, inspection, changeover, cleaning, and recovery allowances rather than a theoretical maximum speed. Factory acceptance test protocol; sustained production trial; cycle-time study; uptime assumptions; performance data under normal operating conditions. High
Integration 15% Compatibility with conveyors, feeders, vision systems, packaging equipment, manufacturing execution systems, and existing control architecture. Available communication protocols; I/O count; data exchange requirements; line speed synchronization; footprint; utilities; installation interfaces. Define mechanical, electrical, software, and data interfaces before purchase; identify every third-party dependency and integration owner. Layout drawings; interface control document; network and I/O list; software architecture; integration schedule; site acceptance criteria. High
Safety and Risk Control 15% Protection against crushing, trapping, impact, unexpected restart, sharp tooling, stored energy, and access to hazardous motion. Risk assessment; safeguarding method; safety-rated monitoring; emergency stops; guard access; lockout/tagout provisions; safe speed and separation controls where applicable. Complete a documented risk assessment and validation before production use. Select guarding and safety functions based on the actual hazards, not on the robot type alone. Risk assessment; safety circuit validation; guarding drawings; safety function data; operating and lockout procedures; training records. High
Changeover Flexibility 10% How quickly and consistently operators can switch between products, recipes, tooling, and packaging formats. Changeover duration; number of manual adjustments; tool exchange method; recipe management; parameter access control; setup error rate. Prefer repeatable, guided changeovers with stored recipes and clear verification steps; calculate changeover time from the last good unit to the next good unit. Changeover demonstration; standard operating procedure; recipe-management screenshots; tooling identification and storage plan. High
Maintenance and Serviceability 10% Ease of inspection, cleaning, lubrication, component replacement, fault diagnosis, and access to technical support. Preventive-maintenance tasks; mean time to repair; spare-parts lead time; diagnostic capability; remote-support requirements; technician skill level. Require a documented maintenance plan, accessible wear parts, clear fault codes, and defined response times for critical failures. Maintenance manual; recommended spare-parts list; service-level terms; troubleshooting guide; training plan; maintenance-time estimates. High
Scalability and Modularity 10% Ability to add products, robots, tooling, inspection, feeding, or parallel stations as demand changes. Available controller capacity; expansion space; modular software design; additional electrical capacity; standardization of tooling and interfaces. Document the next expected capacity step and its cost, floor-space requirement, downtime, and integration impact before selecting the initial configuration. Future-state layout; expansion quotation; controller and network capacity statement; modularity plan; standard interface specifications. Medium
Total Cost of Ownership 10% Lifecycle cost rather than purchase price alone, including installation, tooling, training, energy, consumables, maintenance, and downtime. Capital cost; installation hours; annual maintenance cost; energy consumption; spare-parts cost; expected service life; labor redeployment; downtime cost. Compare at least a three- to five-year lifecycle model using the same throughput, labor, uptime, and maintenance assumptions for every option. Itemized quotation; lifecycle cost model; utility requirements; warranty terms; consumables list; installation and commissioning estimate. High
Operator Usability 5% Whether operators can run, adjust, clean, and recover the system safely and consistently. Interface clarity; alarm guidance; training duration; recovery steps; language options; access permissions; ergonomic reach and posture. Use representative operators in a usability trial and verify that routine tasks can be completed without unnecessary access to hazardous areas. Operator trial results; human-factors review; training materials; alarm list; standard operating procedures; ergonomic assessment. Medium
Quality and Traceability 5% Capability to detect placement errors, missing products, damaged products, incorrect orientation, and process deviations. Defect detection rate; false reject rate; inspection coverage; barcode or recipe traceability; data-retention period; audit trail. Define measurable acceptance limits for critical defects and validate the complete inspection and reject path using known-good and known-defective samples. Vision or inspection validation report; defect library; traceability specification; sample datasets; reject confirmation test. Medium
Total Evaluation Weight 100% Score each dimension from 1 to 5, multiply by the assigned weight, and compare the weighted totals only after all mandatory safety and integration requirements have been met.
Scoring guide: 1 = unacceptable or unproven; 2 = significant gaps; 3 = meets basic requirements; 4 = strong fit with minor gaps; 5 = proven fit with documented evidence. A high score cannot compensate for a failed mandatory safety requirement, unresolved interface dependency, or inability to handle the complete production range.

Calculating Costs, Returns, and Long-Term Business Value

Choosing pick-and-place automation should begin with a cost model, not a machine catalog. Record current labor hours, output per shift, error rates, changeover time, and unplanned downtime. Include the purchase price, tooling, guarding, installation, programming, training, energy, maintenance, and integration. A low quote can become expensive when conveyors or inspection systems are missing. Get written assumptions. They matter.

Estimate annual benefits using measurable production data. Calculate labor hours genuinely released, additional saleable units, lower scrap, and fewer stoppages. Do not treat every saved hour as cash; reassigned workers may still be essential elsewhere. A simple payback calculation divides total project cost by annual net benefit. For example, a 120,000-dollar project producing 48,000 dollars in yearly net benefit returns its cost in 2.5 years. Validate the numbers across busy and quiet seasons.

Long-term value depends on flexibility. Check whether the system can handle new part sizes, recipes, speeds, and product changes without major rebuilding. Ask about spare parts, response times, software access, safety reviews, and operator skills. Track uptime, cycle time, quality loss, and maintenance spending after launch. The first forecast may be wrong. That is useful. A quarterly review can reveal hidden costs, such as small jams consuming hours each week, before they damage the business case.

How to Choose Pick and Place Automation for Your Business

Calculating costs, returns, and long-term business value

This planning model compares manual handling with semi-automated and fully automated pick-and-place systems. Values are shown in USD thousands. Annual labor savings are estimated from reduced repetitive handling, while three-year net value is calculated as three years of savings minus the initial investment. Actual results depend on throughput, operating hours, labor rates, integration costs, and maintenance requirements.